
Adi Eyal is the Director of Code4SA, an NPO dedicated to freeing data in South Africa and teaching people what they can do with it. This blog post first appeared on the Code4SA site here.
Cape Town is the first city in Africa to open up their data. Having played with it quite a bit, I have written down my initial thoughts.
But first some bling
What’s the point of gazing at one’s navel without actually getting your hands dirty. I poked around for a meaty dataset that I could use to put together a visualisation. Firstly, a caveat, I generally hate empty visualisations. Lovingly known as data porn, these types of graphics forget that data should be used to tell a story. Instead they exist for their own sake, providing 30 seconds worth of entertainment as you click around the screen. In this case, I’m making an exception. Mostly because it’s fun but also because I prefer to focus on the portal itself.
Blah Blah Blah – get to the point
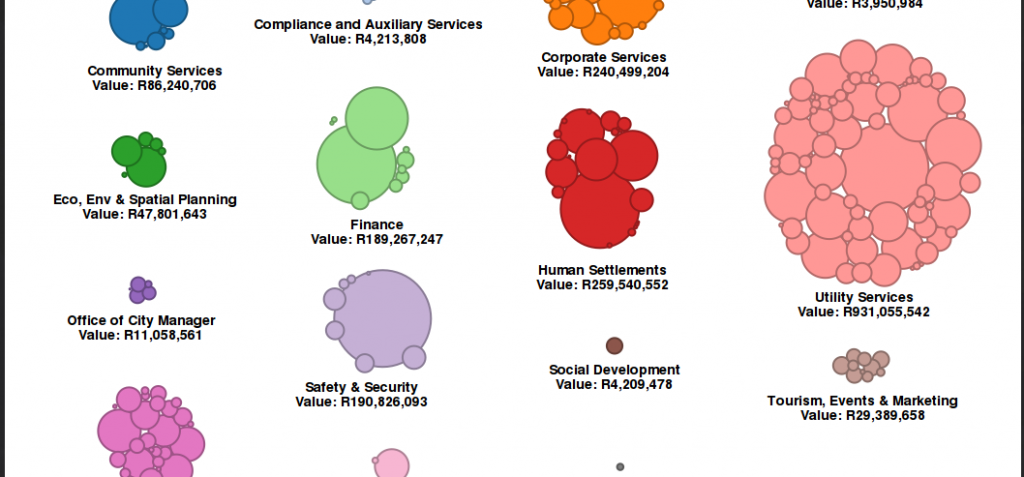
Ok here it is. I wanted to get a general sense of what the City is spending its money on. The graphic below represents all awarded tenders between July and December 2014 as bubbles. The bigger the bubble, the larger the tender. Departments are encoded with colours. Community Services – Blue, Utility Services – Pink, Finance – Cream Soda, etc.
Note from Ed – You can use the scroll bars to move around the dataviz, or click here to see the full thing.
Disclaimer
This visualisation uses data that can be found on the City of Cape Town’s open data portal. Don’t use it to plan your financial future or wring your hands over how your tax money is being mismanaged. The data might be incorrect so it’s best to get it from the source if you’re going to do something useful with it. According to the Terms of Use on the site, I am meant to tell you a bunch of stuff about how the City can’t be held liable for providing incorrect data. I should also mentioned that:
The User (including its representatives, agents and employees) will not at any time, or in any manner, lower the dignity, standing and reputation of the CITY or in any way contest the validity of, or prejudice, any of the City’s IP.
So, please don’t lower the dignity, standing and reputation of the City. I might get into trouble.
The visualisation is based on the excellent example code written by Jim Vallandingham.
So, how did the portal fare from a users’ perspective?
Creating the visualisation was fun but getting the data wasn’t. Initially, I was interested in using data from the budget files available on the site. Exploring finely grained expenditure could tell an interesting story.
Perhaps I am missing something (I am not a Windows user) but the budget Excel spreadsheets on the portal seem to link to an external file which is not included. This means that the vast majority of the data is missing, making the budgets completely useless for my purposes. Regardless, the budget file is very complex. You really need a manual to understand what’s going on there. That isn’t a problem per se, I don’t expect the City to put in a ton of work to change their existing datasets to make them more palatable to the general public. It would however be nice if they provided a link to some documentation that would help me interpret the files.
As a fallback, I tried the tender documents. Available are awards for the 2014 and 2015 (up until December) financial years. More historical data would be helpful but this is a reasonable starting point.
Having worked with them, I would rate the quality of the files as mediocre. The value column which shows the size of the tender is not machine readable which meant that I needed to write a script to clean it up. To better explain what I mean, here is an example of what I found in the value column –
R2 799 900.00 (excl. VAT).
Using this format, I can’t apply simple operations such as sum the value of all the tenders for instance. Excel won’t let you total up a column of values that look like that. To clean it, I needed to remove the ‘R’ from the front, delete all spaces between the numbers and remove the (excl. VAT) text. Approximately 300 tenders were awarded between July and December. If you aren’t a programmer or an Excel wizard, you are going to have to clean each number individually before being able to use the data. This isn’t the only problem with the values in this column. In some cases, the value column only has the word emailed in it. What does that mean? How about:
- Income To City
- 800 000 p/m
- 17 752 760.30 p/a
I even noticed a couple of amounts with a ± in front of them. Do we not know how much was awarded?
This brings me to my next point, where is the metadata? In general a dataset should come with a description of what the dataset is about. It should describe what each column means, how the data was collected and what each value means? Without metadata, we are left guessing what Income To City means.
The department column which specifies under which department this tender falls does not contain standard values. Compare:
- Econ, Enviro and Spatial Planning – Environmental Resource Management
- Economic, Environment & Spatial Planning
- Economic, Environment and Spatial Planning
Notice the different spellings? Without standardisation, I cannot easily calculate the total value of all tenders for that department. Thankfully as there were only 300 values and some quick cutting-and-pasting along with nimble fingers and search-and-replace I managed to clean that up in a few minutes.
If I were to design the dataset myself, I would clean up the values and department fields. I would ensure that all department names were standardised and I would create an extra three columns. One to indicate whether VAT is included or not, a second to indicate whether the cost is monthly, per annum or once off. I’m not exactly sure what the third one would contain but I would stuff the ‘Income to City’ and ’emailed’ comments in there. A code for the supplier might also be useful as currently, it is not easy to see whether one supplier won multiple tenders.
Here is a simple attempt at cleaning the data up. We could do more but even these minor fixes make the dataset machine readable and a lot more useful than it was before.
To finish this point, I want to stress that I wouldn’t want the City to hold onto the data forever for fear of releasing data that isn’t 100% clean. Obviously we don’t want junk in there but it is reasonable to expect mistakes here and there. I would hope that users of these datasets would identify mistakes and alert the custodians of the datasets so that they can be corrected.
The other thing that surprises me is that the City chose to build their portal in-house rather than using one of the existing platforms. The UK open data portal for instance uses an open source platform CKAN. A commercial offering called Socrata is also available if you feel like you need the security of using a closed source solution. The benefit of using an existing platform is that you’re benefiting from the wisdom of those who came before you. It is also often much cheaper than doing it on your own. Our own modest data portal uses Socrata. As a developer, for me the killer feature here is that every dataset comes packaged with a pre-built API and documentation. It also allows non-technical users to create graphs and maps without having to download the data and opening up the spreadsheets. The City’s website in contrast, is not much more than a collection of links.
Finally, I am not really impressed with the datasets in general. They have included the locations of parks, firestations and cemetaries. A list of resorts, and my personal favourite, the Electricity Supply Authorities. The csv file has exactly 5 rows in it (including headers). I’m a serious data geek but I found very little to get excited about. The City could have stuck their neck out a little more and handed over real data. Instead they preferred to publish data that was mostly already available anyway.
In short, I think that the City’s open data portal has a way to go. I get that they are trying to be conservative starting out. But they have given us so little that they might be dooming themselves to failure. Having said that, I don’t want to be overly negative. All software systems have teething problems. Taking an iterative approach gives you time to learn about your users and what they want. Hopefully the City is forward looking on this and has plans to actually support and grow it.
We finally have an open data portal. The only way that it will improve is if users like you and me actually use it and bang on the City’s door requesting more datasets. Hopefully, when the open data steering committee meets again in 3 months time, a whole lot of new, more useful data will be released.
Note: This post was originally published under a Creative Commons Attribution licence, which supercedes our general licence below.

